Contact us: germinate@hutton.ac.uk or @germinatehub on Twitter
Session 7: Phenotypic data
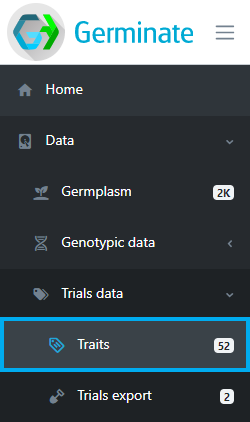
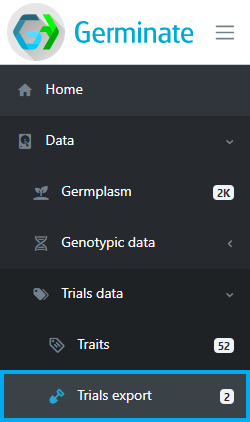
This tutorial will show you how to explore, visualize and export phenotypic trials data. We can access traits by clicking on the Traits option in the left hand side menu in Germinate. Traits is found under Data -> Trials Data.
Traits
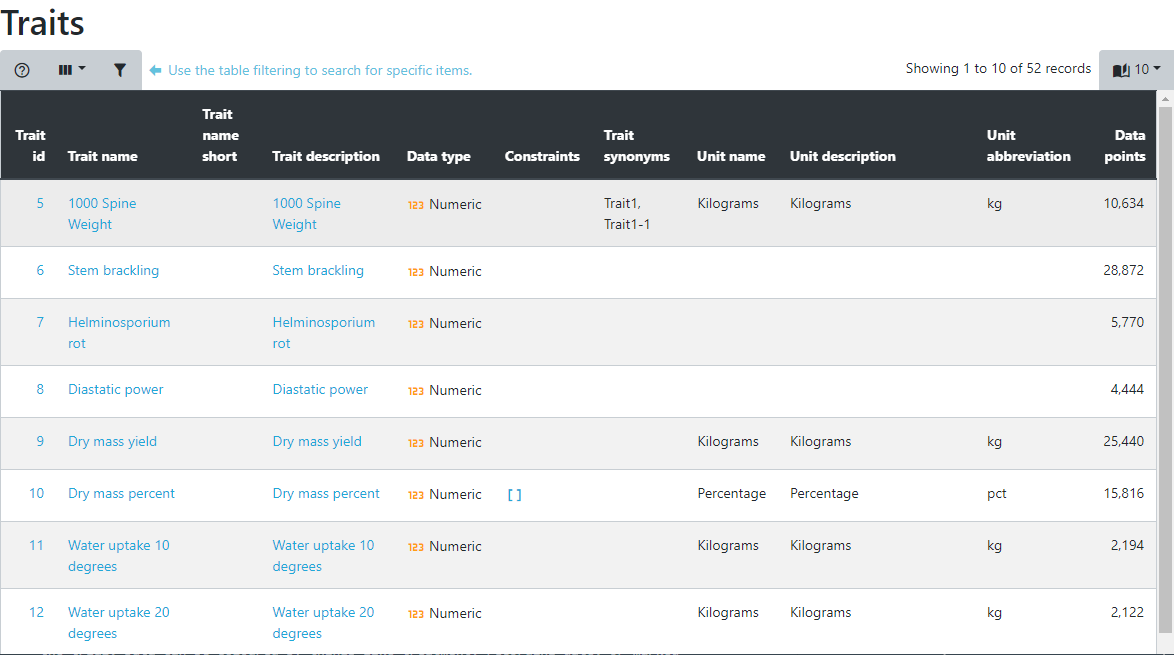
The traits page shows all traits that have been scored across all trials within Germinate, their data types, synonyms, units and how many individual data points have been recorded.
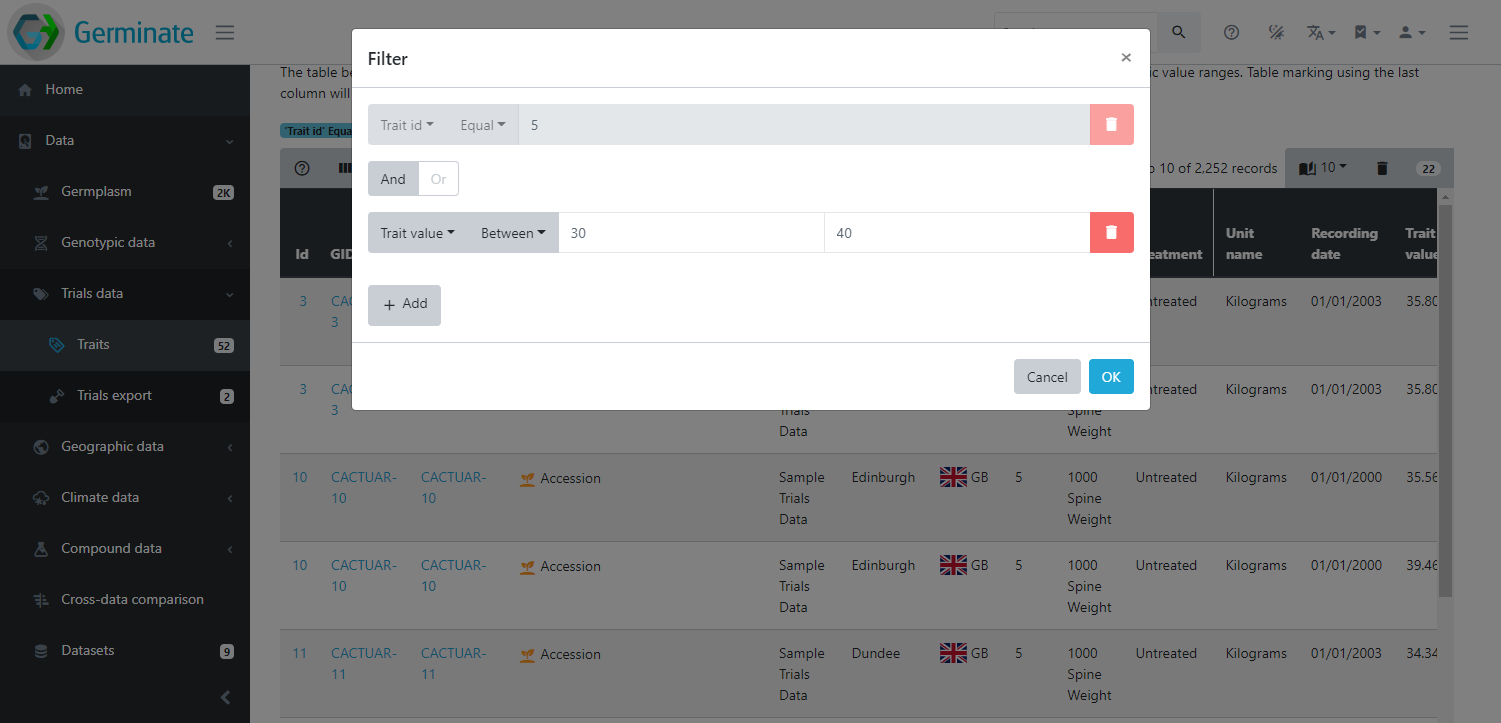
Selecting a trait by clicking on it opens the trait details page with all values for this trait in a table. As with all other tables, this one can be sorted and filtered, allowing you to search for things like which germplasm has the highest or lowest value or you can search for germplasm within specific ranges. Just click on the table column headings to sort or on the table filter option found at the top left hand side of the table.
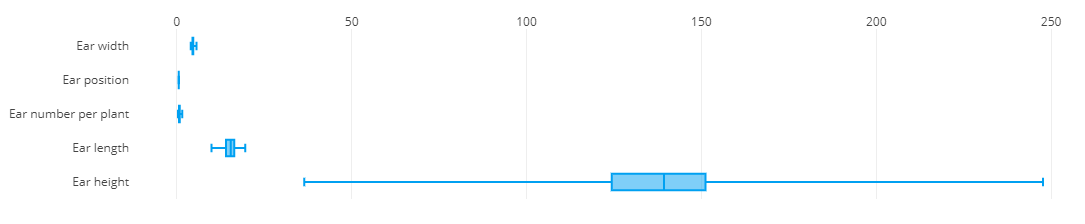
Below the table, a chart shows the distribution of values for this trait. In case of numeric traits, a boxplot will highlight the quartiles and for a categorical trait, a histogram is displayed. These charts are interactive so you can hover your mouse over elements to get more information.
Trial data export
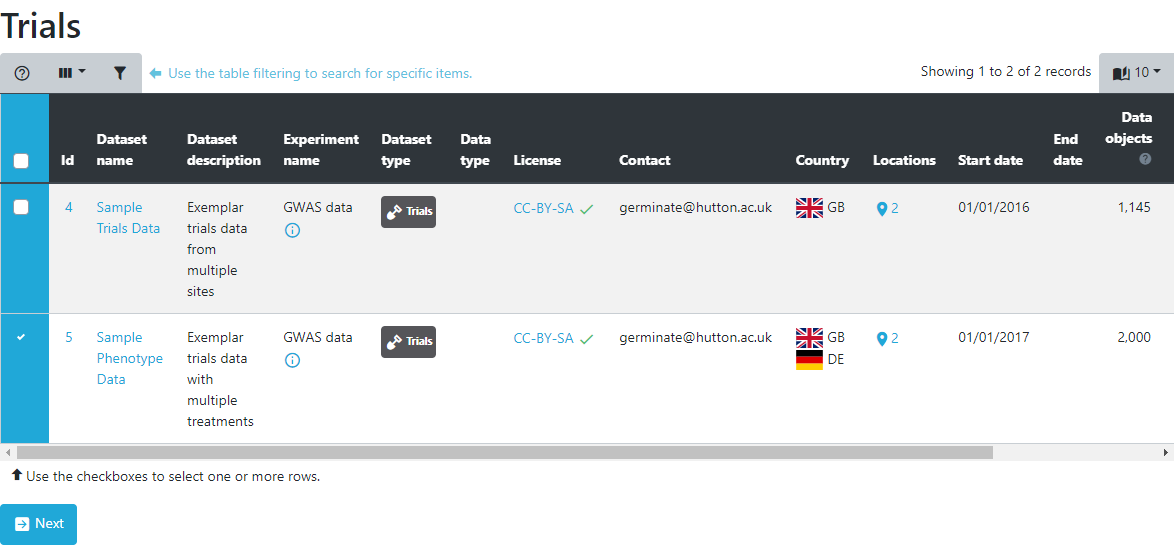
Comparing trials in different locations or across years as well as comparing traits to identify correlations and outliers can provide detailed insight into the data. The trials export page has a variety of visualization and query interfaces to explore trials data. Lets get started by selecting Trials export from the left hand side menu under Data.
The table displayed shows the available trials datasets that are containes in Germinate. Select one or multiple trials from the datasets table to continue. Multiple datasets can be selected by clicking on the checkbox to the left hand side of the table. Once you have selected a dataset(s) click on Next to retrieve information on the selected dataset(s).
Trials information is broken down into differnt sections. Each one offers a different perspective onto the data and various ways of sub-selecting germplasm and traits as well as different colouring options.
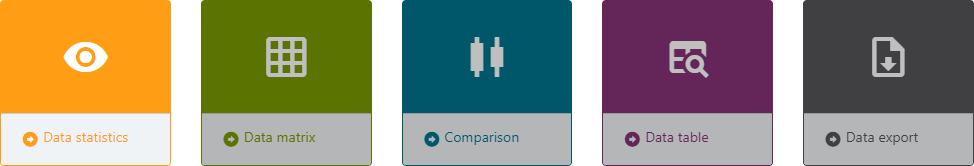
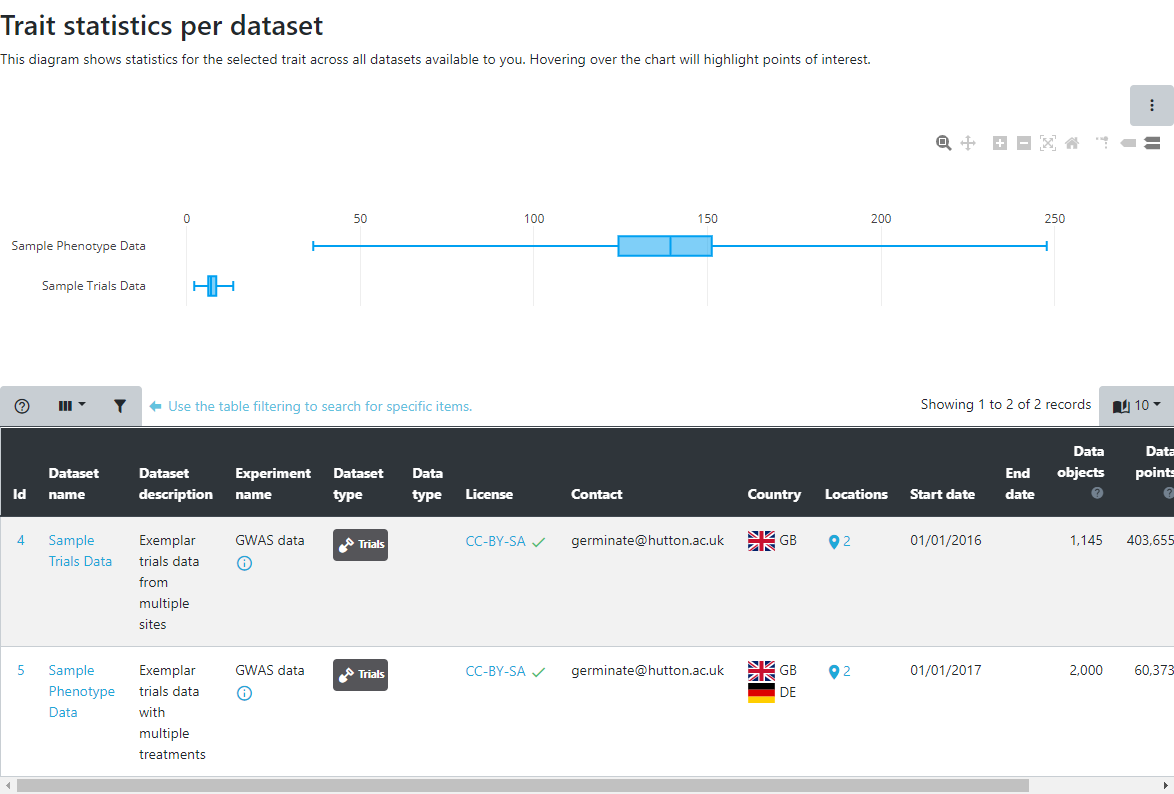
The overview statistics show overall characteristics of the data within the selected datasets. Select the traits you want to see and optionally some germplasm groups. The resulting chart shows a box plot per trait and dataset highlighting the spread within a trait as well as the differences between selected datasets. If the datasets are from different locations/sites or years, this chart is an ideal way to compare these scenarios.
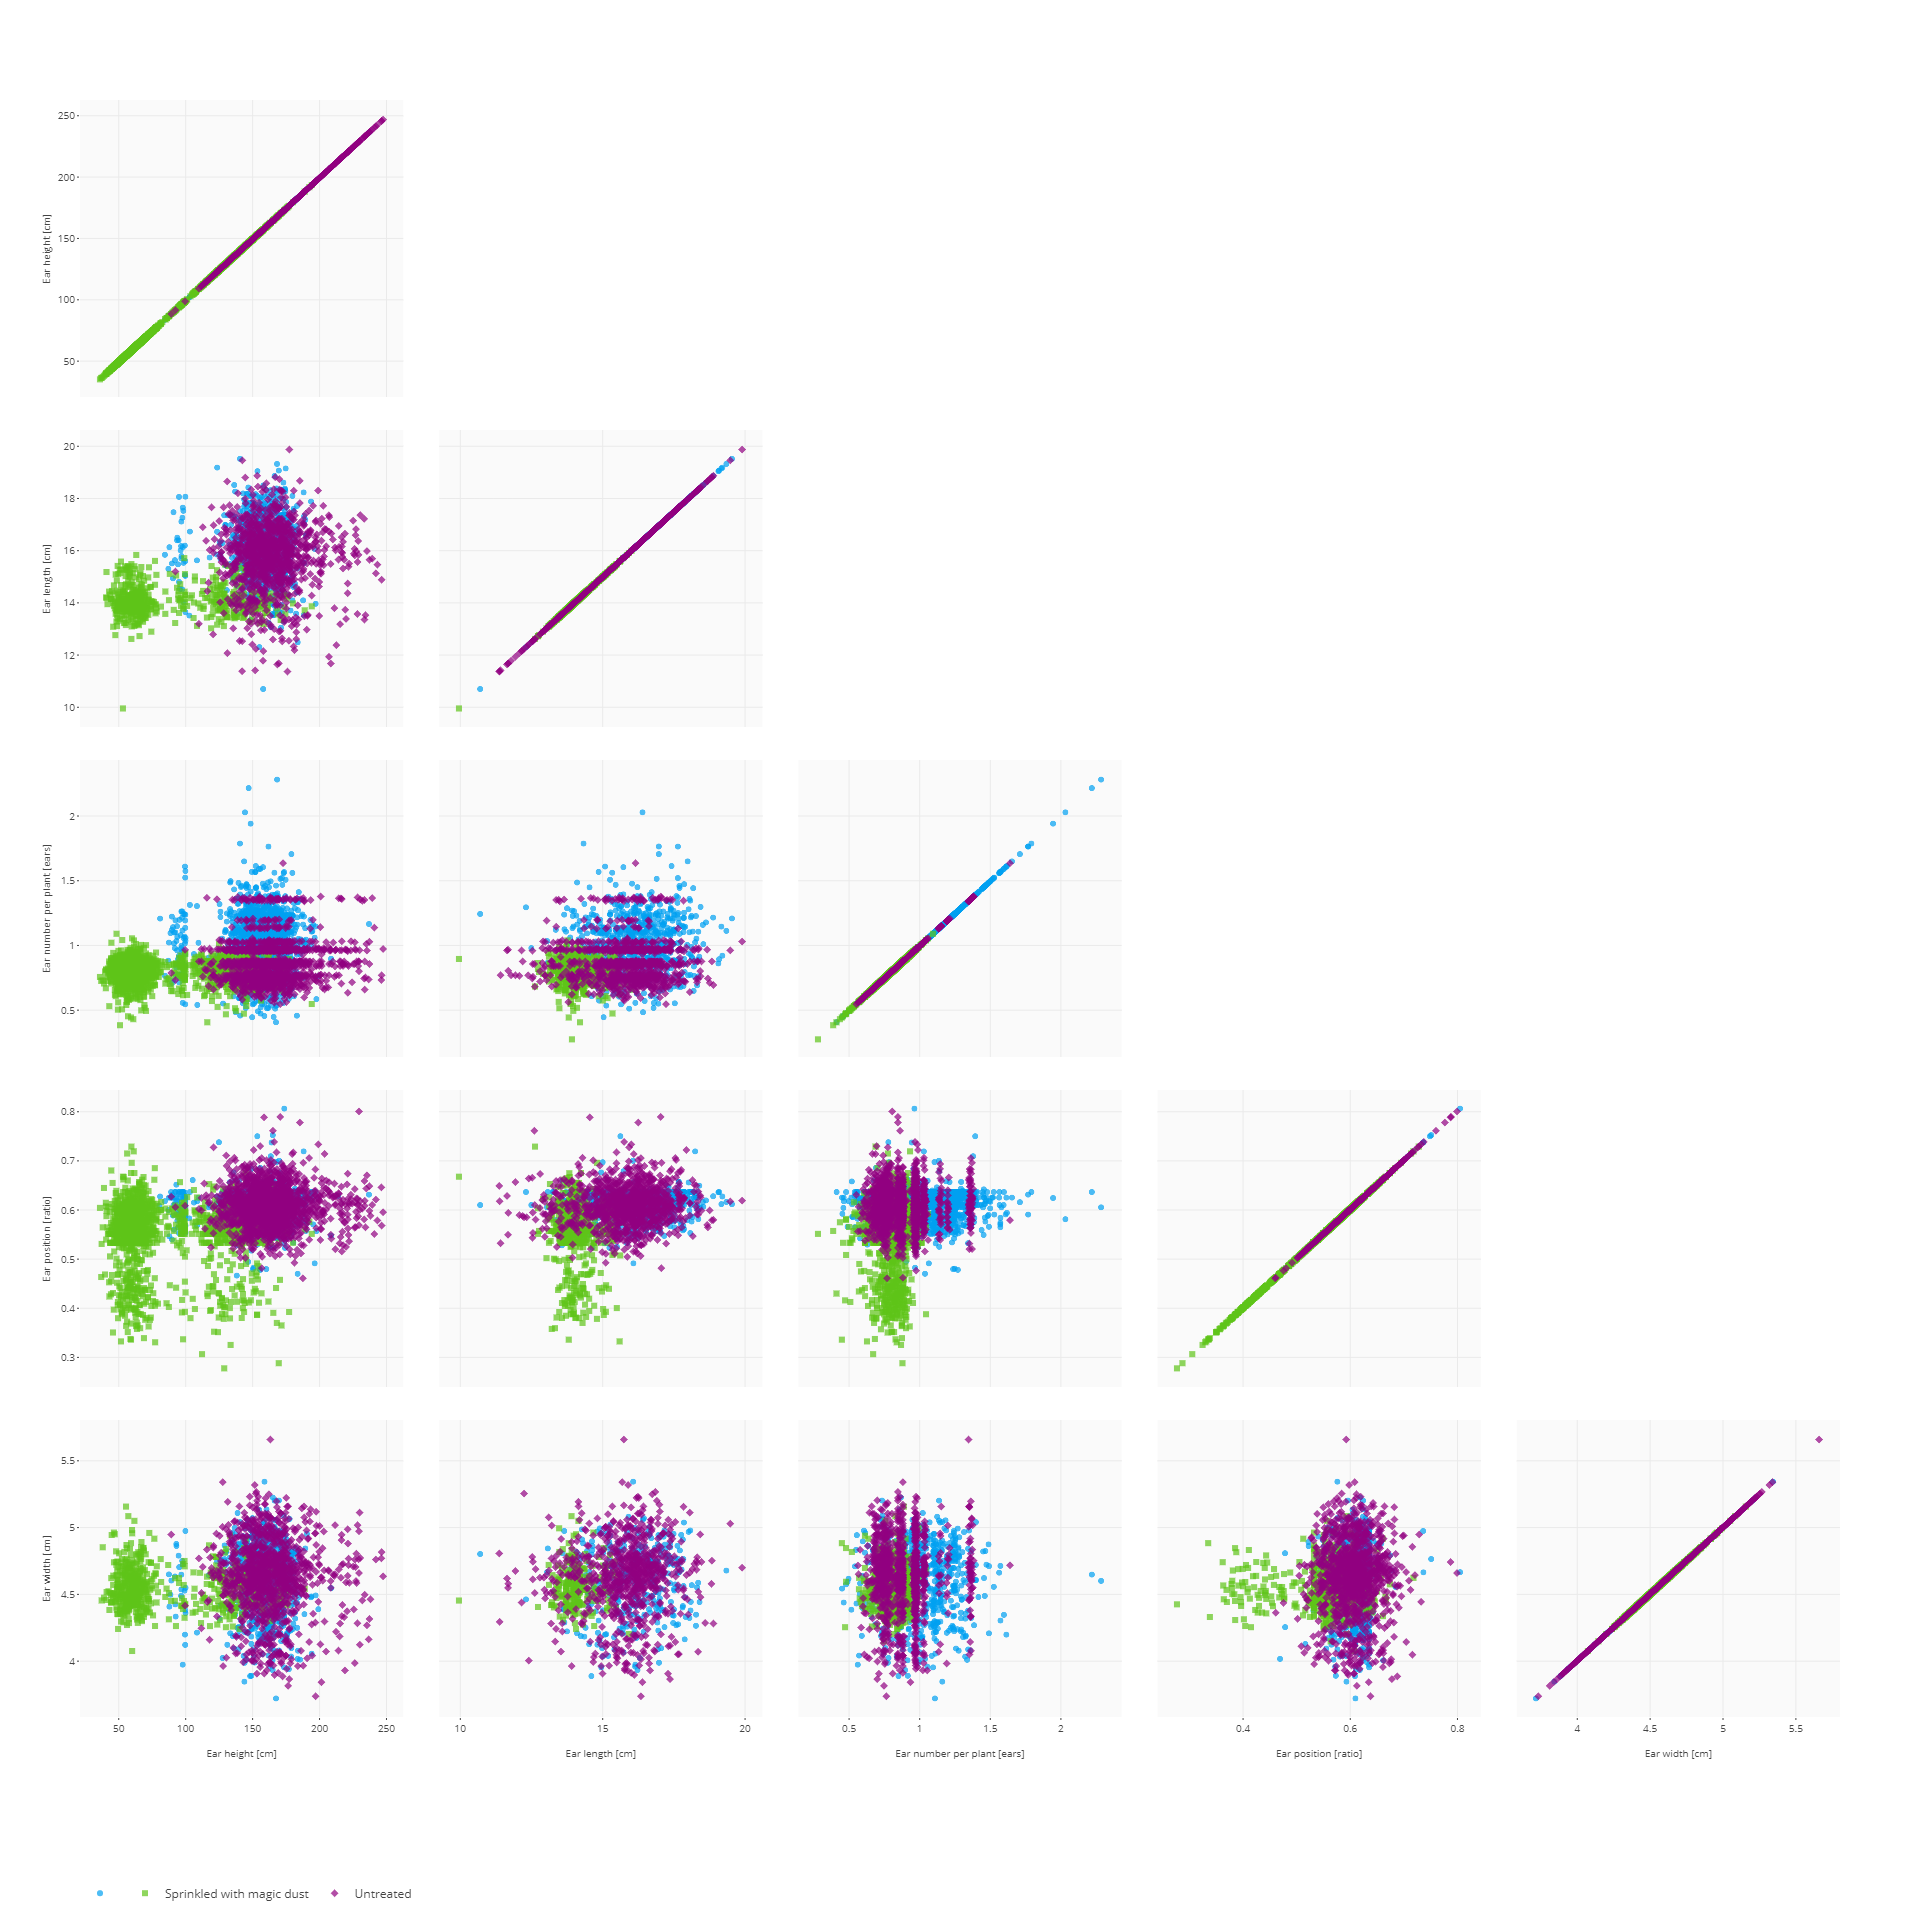
In the data matrix section, traits are plotted against each other to highlight patterns in the data like correlations and outliers. The traits that should be plotted are selected from the list. Optionally, a sub-selection of germplasm can be made to limit the visualization to only germplasm from these subsets. The resulting visualization is a matrix of scatter plots, each showing the combination of two traits. Each data point represents a germplasm scored for those two traits within the trial. Data can be coloured by things like treatment, recording date, or marked germplasm to further highlight the differences in the data.
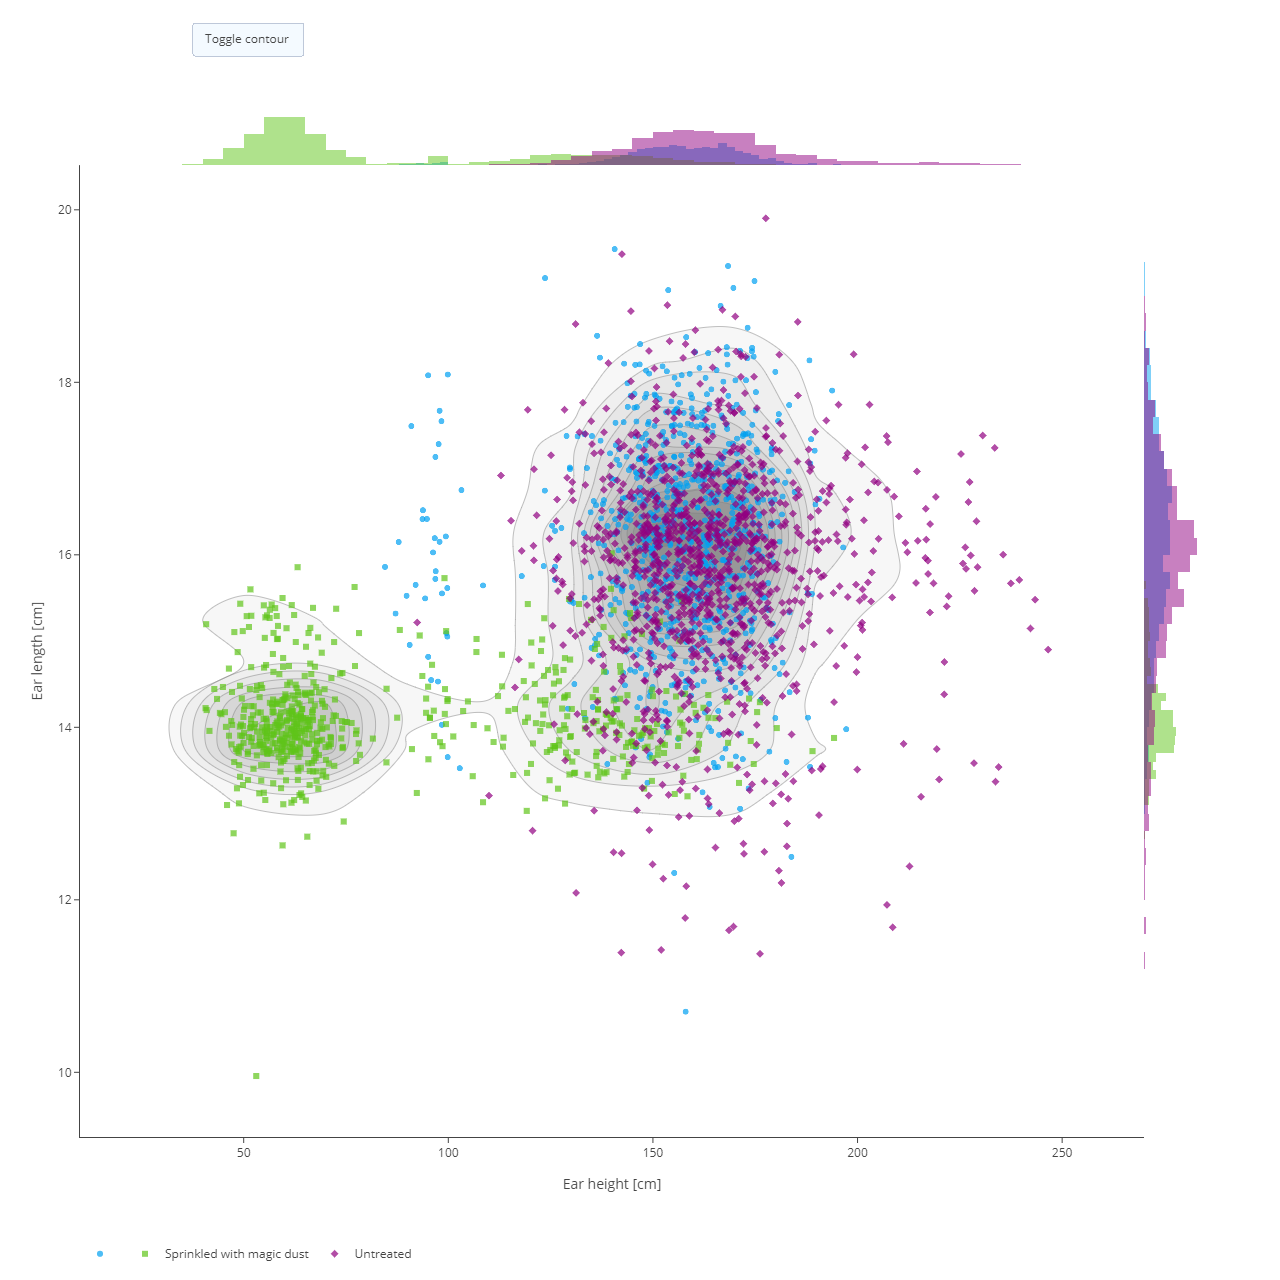
Remember all the charts are interactive so hover your mouse over chart elements to get additional information.
If only two traits are selected, a more detailed scatter plot is displayed showing data distributions along both axes. The contour density estimate can be toggled on and off by clicking ont he Toggle contour button.
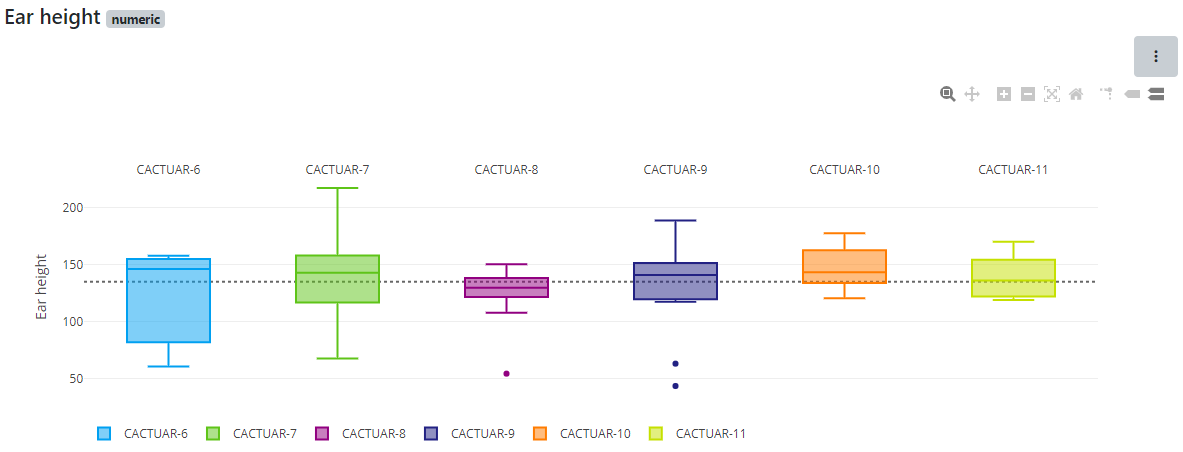
The comparison section will plot a small subset of germplasm side by side for a selection of traits to emphasize the germplasm performance compared to others. It will show a box plot of all values of a single germplasm compared to boxplots of the other germplasm. We have covered how to interpret box plots in other sections but if you need a recap then please have a look at this link.
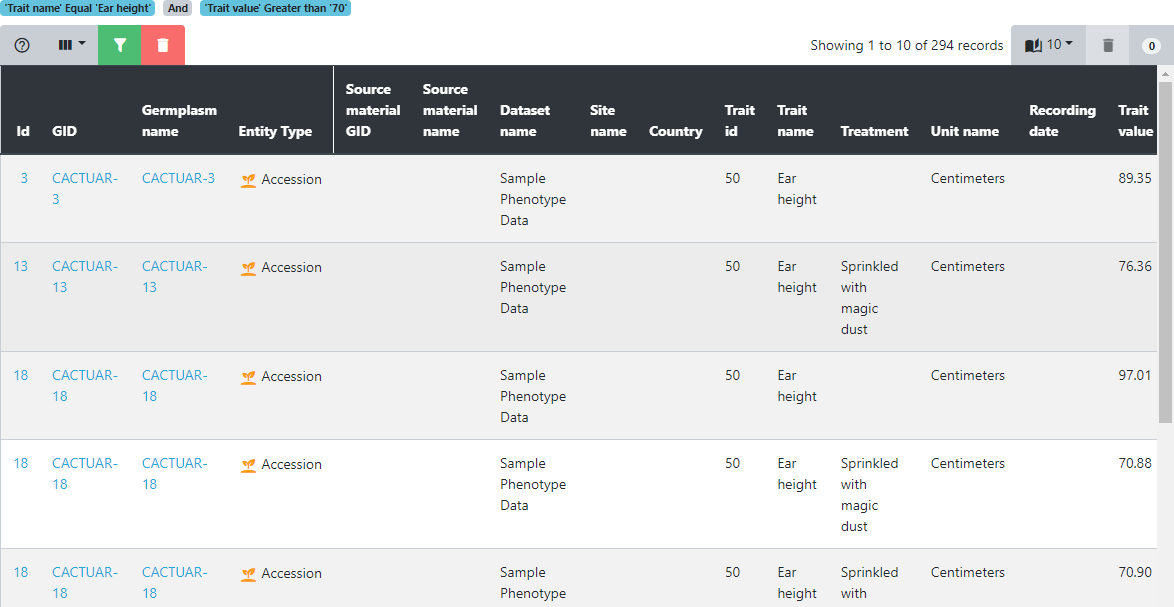
The data table presents a different perspective onto the data and offers all the table filtering and sorting functionalities already seen in previous tutorials. Searching for the data of a specific germplasm or finding germplasm within a yield range or above a certain height are easily achieved using the table filtering options (shown in green here at the top left of the table). In this example we have limited the data to the trait Ear height where the trait value is greater than 70. Filtering conditions can be found at the top of the data table. We can also see that there are 294 records that match these filtering criteria.
The final tab is where data can be downloaded in tab-delimited format. This format allows easy import into tools like Flapjack, Excel, and R. Combining this phenotypic data with the genotypic data in Flapjack.
Tasks
-
Looking at the traits page, how many traits are in this Germinate database?
Answer: There are 51 traits defined in the database. -
Sorting by the data points column, which trait has the most data points and how many?
Answer: The trait 'ear height' has 45,224 data points across 2 datasets. -
Select trait 'Colour of leaf' (categorical data that uses hex colour values to show leaf colour), which value appears most often?
Answer: #27ae60. Note how there are 2 datasets each represented by a diffent colour in the histogram. -
Navigate to the trials export page and select the first dataset (it has an id of 4). Using the overview statistics, which plant line has the highest median value for the trait '1000 spine weight'?
Answer: To get this we can select the 'Comparison; option then the trait '1000 Spine Weight [Kg]' now hover over the box plot to see which has the highest median value. The answer is 'CACTUAR-10' with a value of '46.765'.
Have an experiment with the phenotypic export options in Germinate and try each of the visualizations that it offers. Having an explore of some datasets that you are familiar with is a good way to get up to speed with using the Germinate tools.
Next Steps: We’ve learned a bit about trails data and traits data in Germinate, now lets have a look at working with geographic data in Session 8.
About
This training has been created under the Templeton World Charity Foundation, Inc. Grant ID TWCF0400 ‘Safeguarding crop diversity for food security: Pre-breeding complemented with Innovative Finance’ which is managed by the Crop Trust. This training is free to use and released under a non-restrictive open source licence.